library(tidyverse)
manufacturers <- mpg |>
count(manufacturer, sort = TRUE) |>
mutate(
manufacturer = str_to_title(manufacturer),
manufacturer = fct_reorder(manufacturer, n)
)
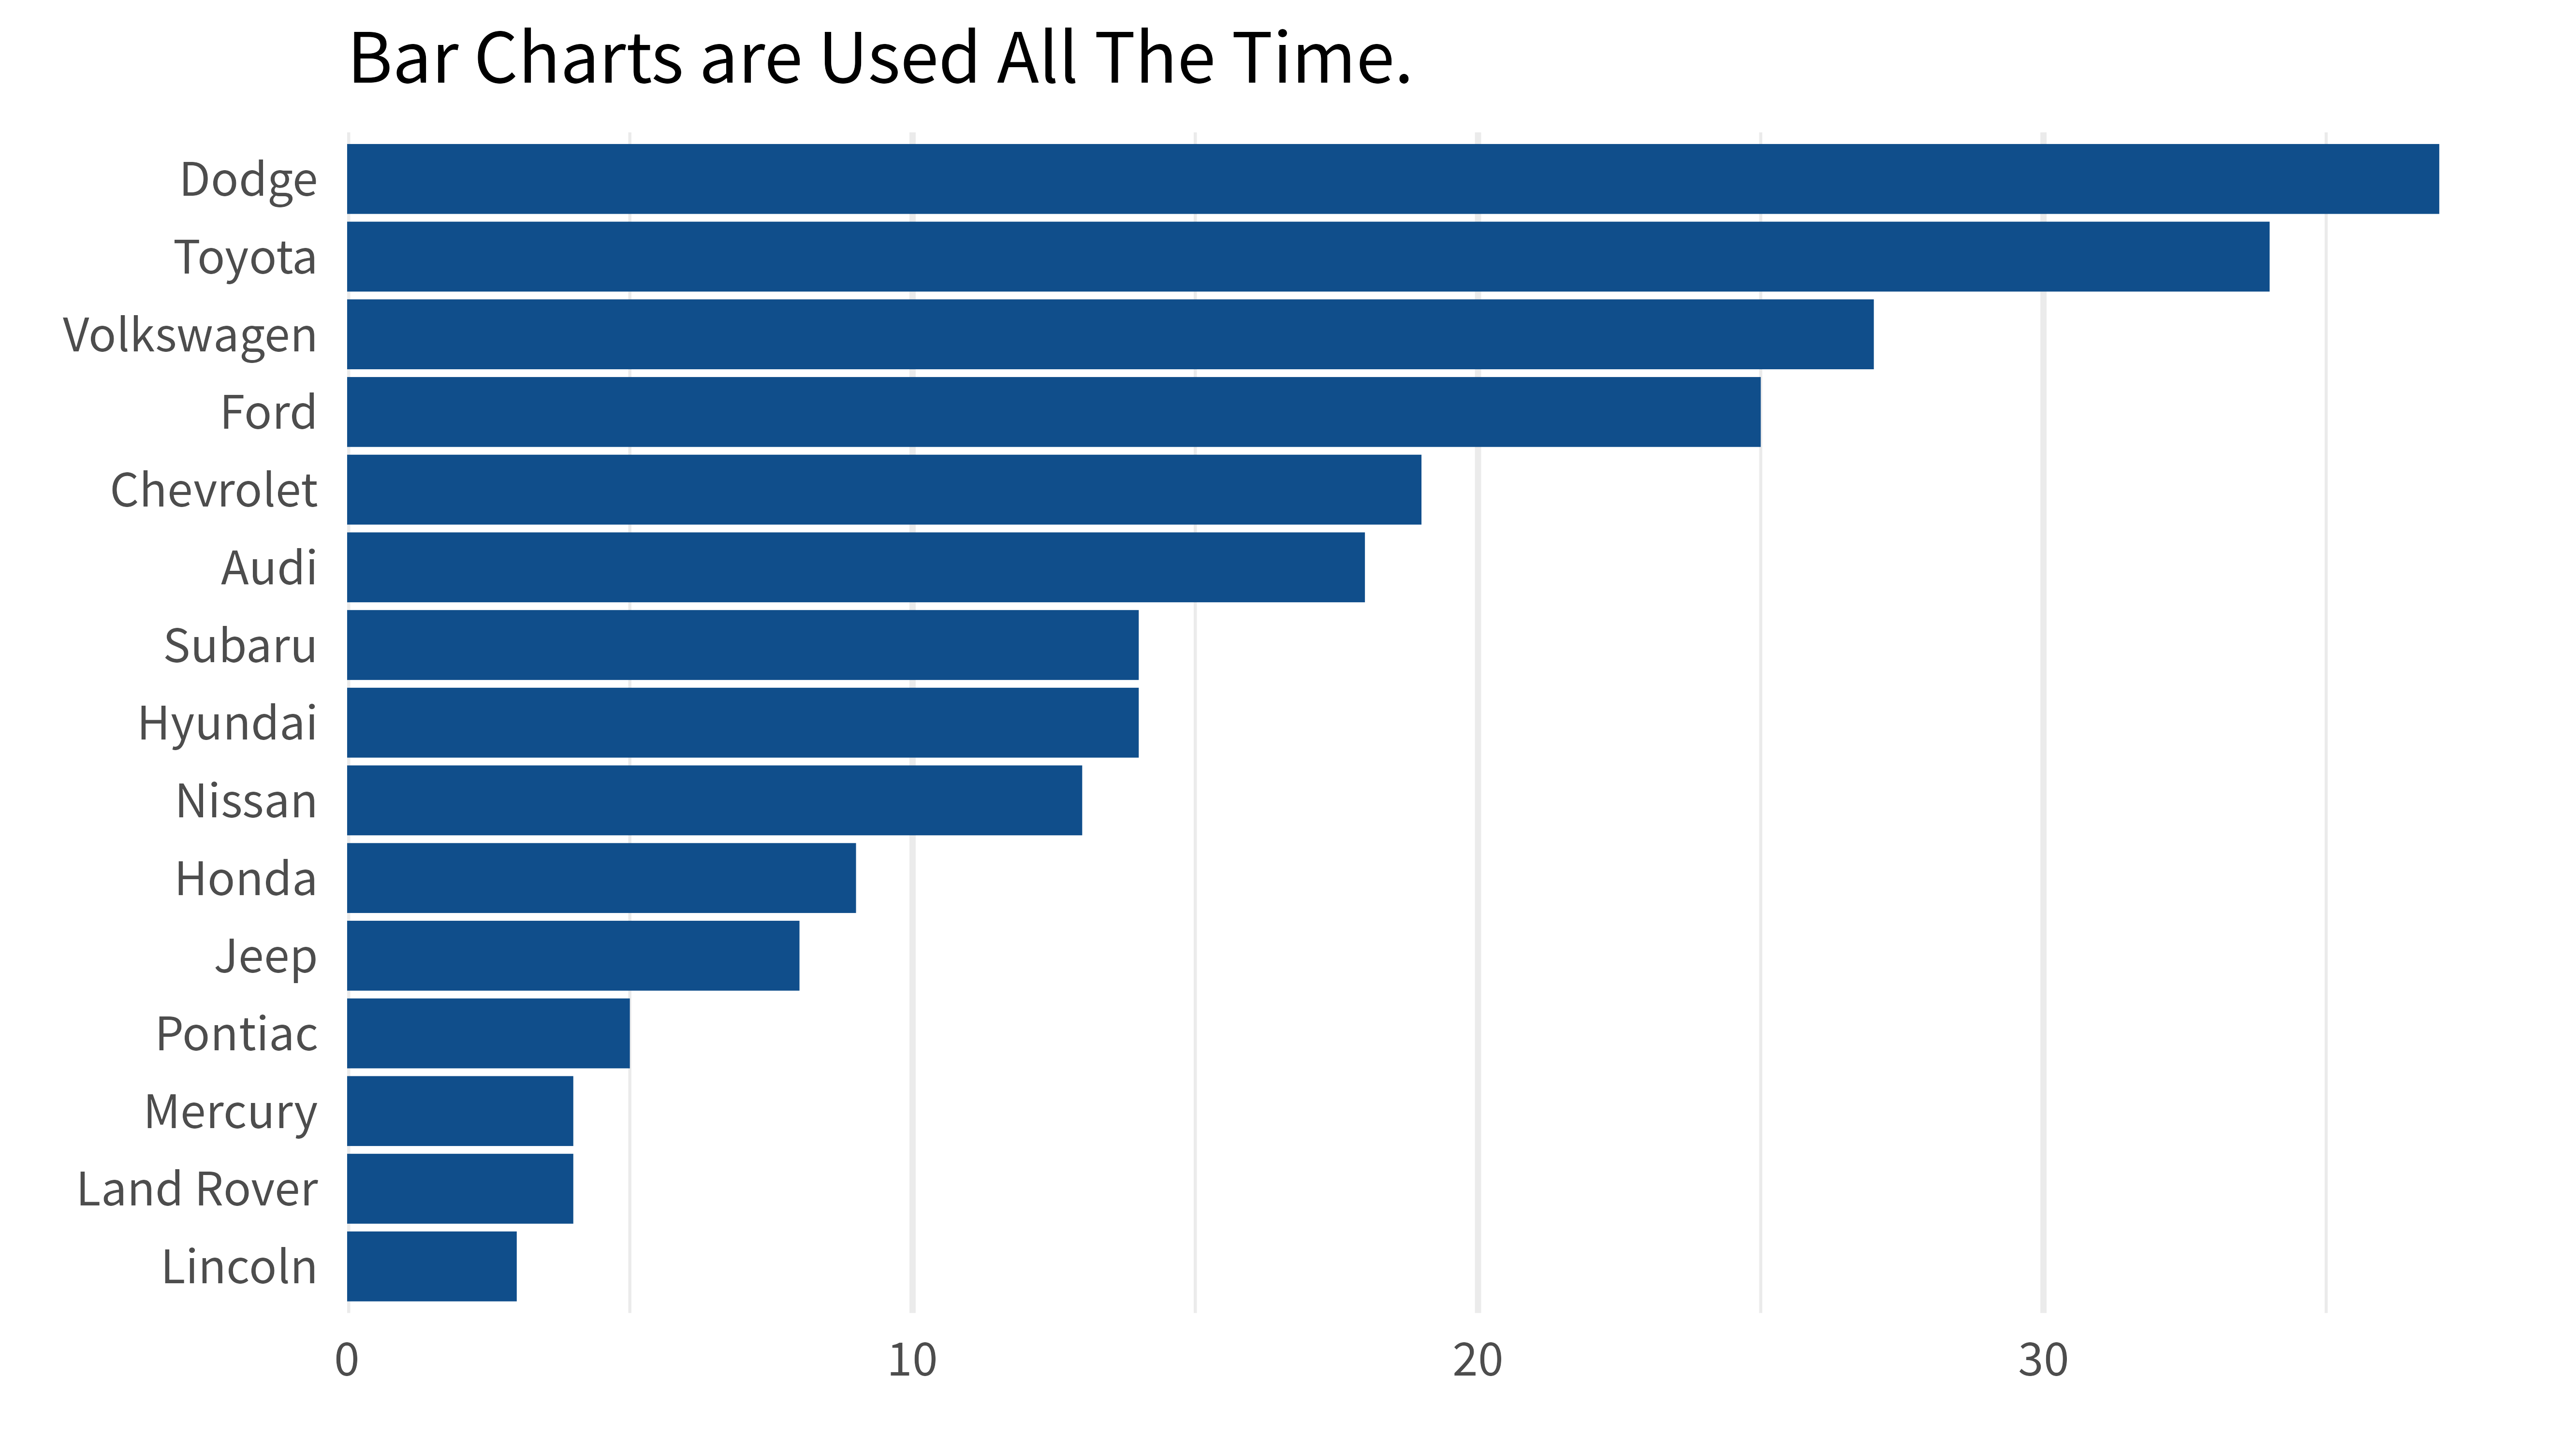
## Bar plot
manufacturers |>
ggplot(aes(y = manufacturer, x = n)) +
geom_col(fill = 'dodgerblue4') +
theme_minimal(base_size = 16, base_family = 'Source Sans Pro') +
scale_x_continuous(
expand = expansion(mult = c(0, 0.05))
) +
labs(
x = element_blank(),
y = element_blank(),
title = 'Bar Charts are Used All The Time.'
) +
theme(
panel.grid.major.y = element_blank()
)
## Lollipop chart
manufacturers |>
  ggplot(aes(y = manufacturer, x = n)) +
  geom_point(col = 'dodgerblue4', size = 6) +
  geom_segment(
    aes(x = 0, xend = n, y = manufacturer, yend = manufacturer),
    linewidth = 2,
    col = 'dodgerblue4'
  ) +
  theme_minimal(base_size = 16, base_family = 'Source Sans Pro') +
  scale_x_continuous(
    expand = expansion(mult = c(0, 0.05))
  ) +
  labs(
    x = element_blank(),
    y = element_blank(),
    title = 'Same Chart, Different Look'
  ) +
  theme(
    panel.grid.major.y = element_blank()
  )
Enjoyed this code snippet?
You may also like my weekly 3-minute newsletter. Reading time: 3 minutes or less.
Or you can check out previous editions of the newsletter at 3mw.albert-rapp.de

