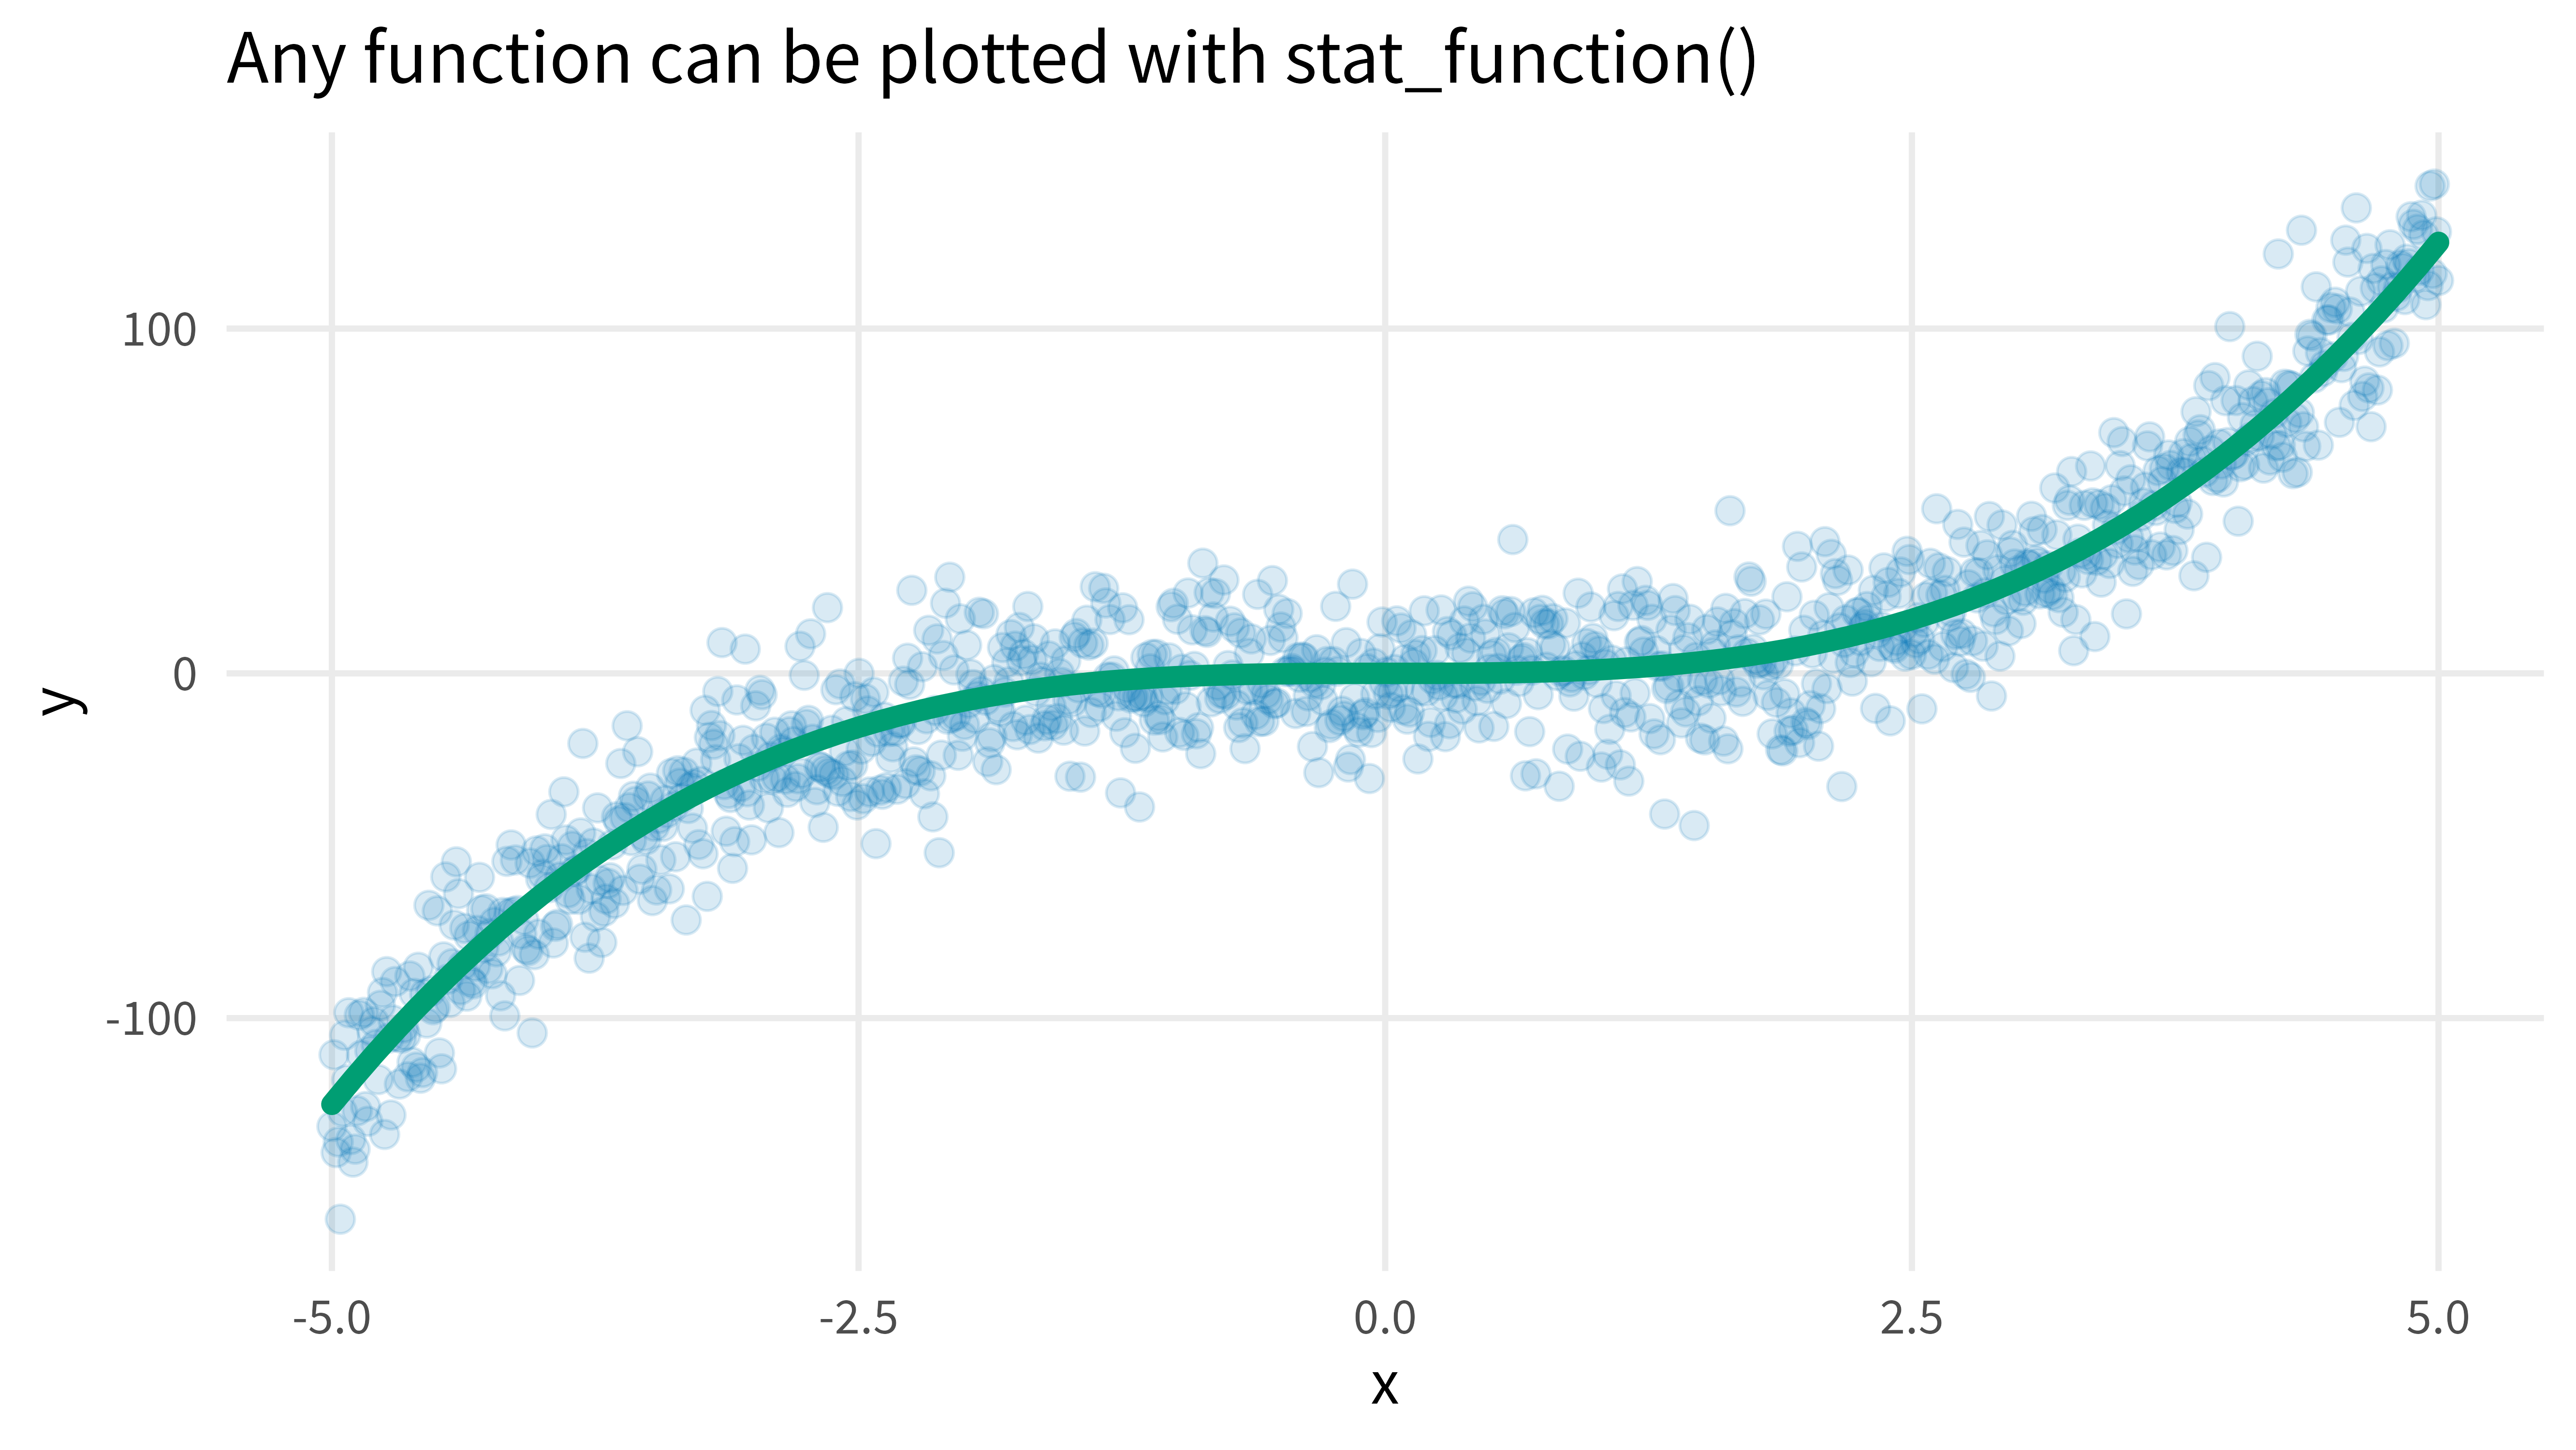
set.seed(45345)fake_dat <-tibble(x =seq(-5, 5, length.out =1000),y = x^3+rnorm(1000, mean =0, sd =15))point_plot <- fake_dat |>ggplot(aes(x, y)) +geom_point(col ="#0072B2", alpha =0.15, size =3)point_plot +stat_function(fun = \(x) x^3, # Put formula from model into a functioncol ="#009E73",linewidth =2.5,lineend ='round' ) +labs(title ='Any function can be plotted with stat_function()')
Enjoyed this code snippet?
You may also like my weekly 3-minute newsletter. Reading time: 3 minutes or less.
Or you can check out previous editions of the newsletter at 3mw.albert-rapp.de